
Written by Nick Ackerman, co-produced by Stanford Chemist
Clough operates three closed-end funds; Clough Global Opportunities Fund (GLO), Clough Global Equity Fund (GLQ) and Clough Global Dividend and Income Fund (GLV). All three funds have a great focus on producing strong distributions. They also all trade at fairly large discounts and have historically. GLO and GLQ are at particularly large discounts that might be worth exploring. GLV is currently a bit rich compared to its historical range.
(Source)
Clough Capital is a very small asset manager with total assets under management of $629 million. This could be reflected in their short history as they were only founded in 2000. They put a focus on global assets - which is represented in the funds they operate.
Each fund has a global tilt. Additionally, each fund has some considerable flexibility in its operations. They have equities and fixed-income exposure in their portfolios. They will also go long/short positions. This can play a tactical role in outperforming peers during sell-offs; that is if they can manage to pull it off consistently. As most investors know, that can be rather difficult.
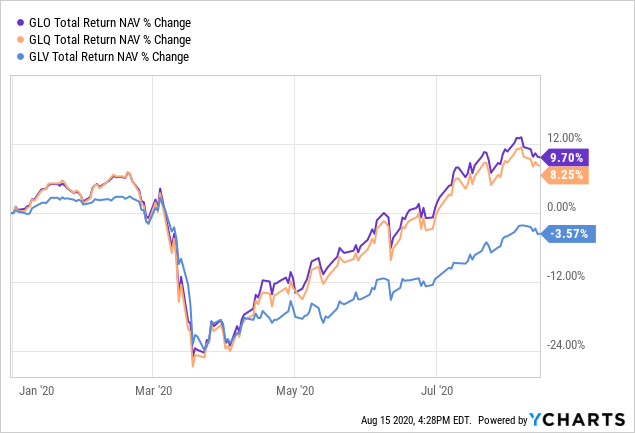
Looking at the YTD performances, and we can see that they are having quite a successful year. On a total NAV return basis, GLO and GLQ are doing exceptionally well. They hold tech positions in their portfolio, which does play a key role in the performance this year. Additionally, though, they hold U.S. treasuries that have rallied significantly. That has helped put those two funds back into the green for the year in a significant manner.
One might be curious that the funds' short positions and treasury holdings also kept these funds from the steepest drawdowns in March. Below is once again looking at a total NAV return basis from February 19th, 2020 to March 23rd, 2020. That is the "broader markets" peak to trough as measured by the S&P 500. Below we include the SPDR S&P 500 ETF (SPY) for comparison on an investible way into the index.
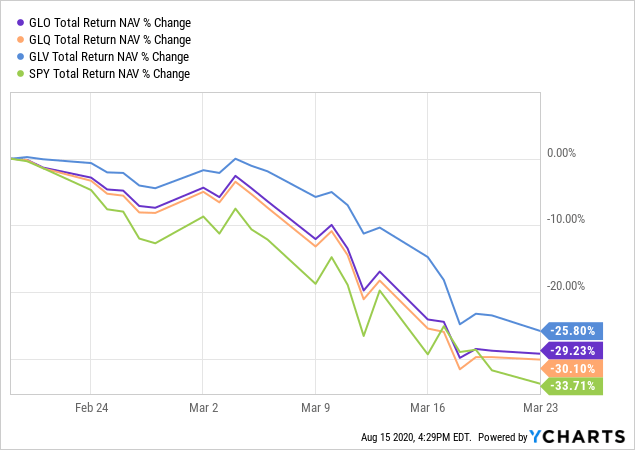
This can be quite attractive for some investors that want to mitigate downside moves. At the same time collecting attractive distributions.
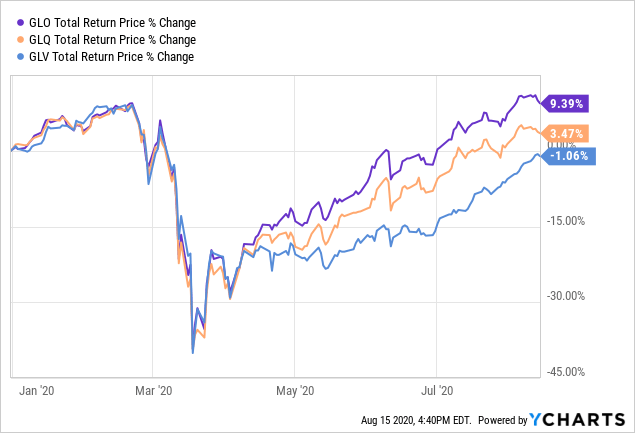
However, this is looking at performances measured by NAV. This is a true testament to the performance of managers' abilities to operate funds. As CEF investors know, funds can trade at prices significantly different than their NAV. One thing managers cannot do is control the share price. Above is the funds' total share price returns on a YTD basis.
With that being said, Clough has made strides to do this with an enticing distribution policy. Whether it is sustainable or not is another question. However, each of the three funds has a distribution policy of; "effective August 2017, each Fund’s Board approved a managed dividend distribution rate of 10% of each Fund’s prior month average NAV. Subject to certain conditions, these distribution policies remained in effect through July 2019. Effective August 2019, as approved by each Fund’s Board, each Fund will pay monthly distributions in an amount not less than the average distribution rate of a peer group of closed‐end funds selected by the Board. Subject to certain conditions, these distribution policies will remain in effect through July 2021."
This wording is found in the funds' consolidated Semi-Annual Report. What we can see is that the funds had originally put a policy in place to target a 10% NAV distribution policy that would change monthly. They now target a more ambiguous "in an amount not less than the average distribution rate of a peer of closed-end funds selected by the board." While that doesn't give us an exact amount or even a reference of the funds they target, it does lead to a consistently high distribution rate as we will see.
The expenses can be a bit high for all three of the funds. This is one of the downfalls being so spread out; with the managers investing long/short, global/U.S. and equity/fixed-income positions. That means the managers are probably spending a lot of time moving around the portfolio and also time on research.
For GLV, we have the fund's expense ratio at 1.92%, including interesting expenses and short expenses - this comes to 3.40%. They had a portfolio turnover of 127% for the last 6-month period ending April 30th. The prior full year of 2019 this came to 253% portfolio turnover. Quite a significant amount of moves in the underlying portfolio.
For GLQ, the fund's expense ratio is 2.29%. When we add interest expense and short expenses this comes to 3.78%. Portfolio turnover for them in the same 6-month time period was 131%. Last year they had a whopping turnover of 297%. Which, if we are being honest, probably was a contributing factor to their ~20% NAV returns. 2019 was a strong year for the broader market and many funds, with returns 30%+. Had they just stayed invested and not moved assets around they probably could have performed similarly to their peers. Of course, that is hindsight and everyone is a genius after the fact.
GLO, the largest fund, actually comes in with the highest expenses. For the 6-month period ending April 30th, 2020, we arrive at an expense ratio of 2.46%. Including interest and short sale expenses, we arrive at 4.02%. Portfolio turnover for the 6-month period was 141%; with 2019's portfolio turnover coming in at 306%.
Clough Global Opportunities Fund (GLO)
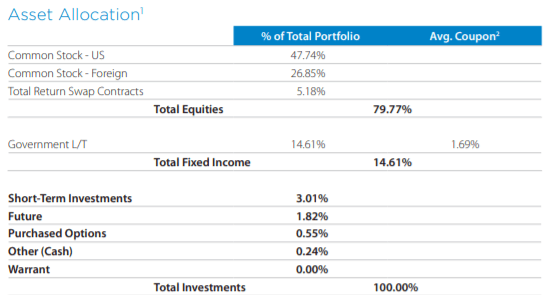
The fund has an investment objective to "provide a high level of total return." Their investment policy is "to invest primarily in a managed mix of U.S. and non-U.S. equity and debt securities. The Fund is flexibly managed so that, depending on the fund's investment adviser's outlook, it sometimes will be more heavily invested in equity securities or in debt or fixed-income securities."
Additionally, they have the ability to use options in their funds as well. They also utilize leverage in their funds. GLO is the largest of all its funds. Total managed assets come in at around $552.6 million. The leverage currently stands at near 32.2% at the end of June.
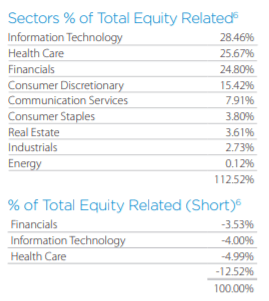
One particular thing I find interesting about this fund is that they are short in the same sectors that they are overweight.
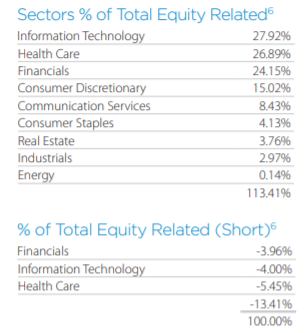
(Source - Fund Fact Sheet)
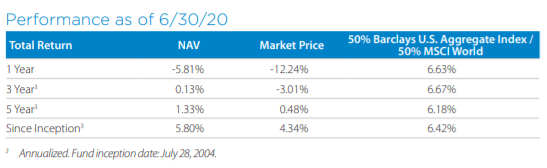
This can be beneficial and give a more balanced approach to their portfolio. The downside here is that being a short fund can lead to some underperformance. This is especially true as a globally focused fund means they have underperformed their U.S. investment counterparts as well. This did lead to some pretty weak performance on an annualized basis for most time periods. However, they have really shined during the last 3-year period.
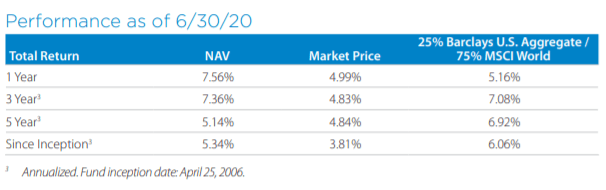
(Source - Fund Fact Sheet)
Of course, this was helped significantly by their almost 10% NAV total return moves in this year alone. Contributing factors include being invested overweight in tech and healthcare. Another massive boost to the portfolio this year was 14.70% being in U.S. treasuries. On the longer-term 5-year basis, that might bring caution to some investors as it means that historically speaking, they haven't been able to "earn" their current distribution.
The latest distribution rate comes to 11.26%, NAV distribution rate is 9.55%. Such a significant divergence between these two numbers is thanks to the fund's excessive discount of 15.17%. On a 1-year basis, the average discount sits at 13.24%. A discount that has plagued this fund (as we will see with the others as well) for many years.
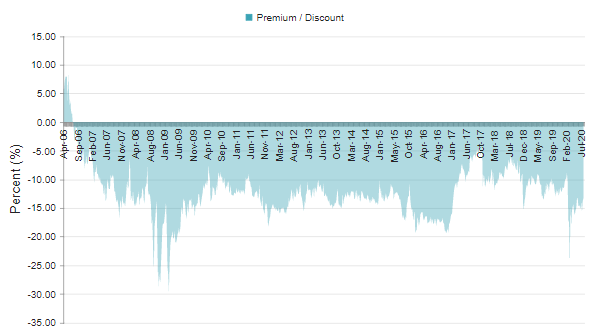
(Source - CEFConnect)
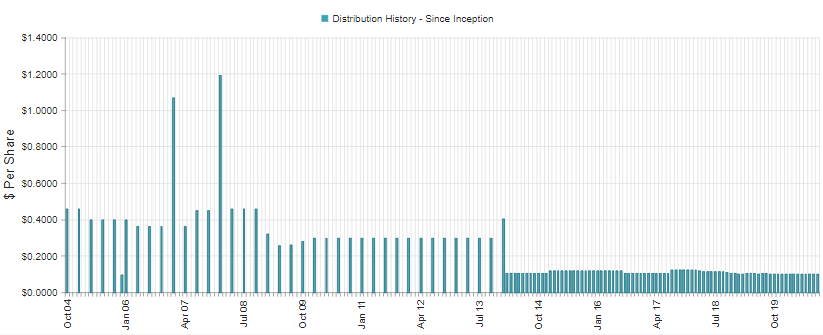
Below is the historical chart of their distributions. Throughout 2017 through 2019 we can see there were many adjustments. This was due to the fund's previously mentioned distribution policy to target 10% of NAV on a monthly basis. They have made it more consistent by announcing the same rate throughout each quarter. For Q1 through Q3 it has been the same monthly rate of $0.0897 as well.

(Source - CEFConnect)
Clough Global Equity Fund (GLQ)
This fund is smaller than GLO at around $275 million in managed assets. The leverage ratio for them comes to 31.81% at the end of June 2020.
The fund has the same investment objective of GLO to "provide a high level of total return." However, their investment policy drops the wording of investing in fixed-income positions. They "intend to invest primarily in a managed mix of global equity securities."
Even with that wording dropped, we see that over 14% of the portfolio is still in U.S. treasuries.
(Source - Fund Fact Sheet)
Their composition in sectors is also consistent with GLO's. As we can see below they are similarly short in the overweight sectors where they are long.
(Source - Fund Fact Sheet)
The distribution history is pretty much overlap with GLO above as well.

(Source - CEFConnect)
They currently pay a monthly rate of $0.1104, which works out to a distribution rate of 11.30%. Again, this is quite enticing for any income investor. Though they have struggled to sustain their NAV over the years while paying this high of a rate. The NAV distribution rate comes to 9.58%. Since the fund has such a high distribution policy, it might come as a surprise but for 2019 they had actually covered their distribution from income and capital gains. The others did have to utilize ROC. However, for 2019 it wasn't destructive as it was for other years.
One area that this fund beats out GLO, is that they have better historical returns on an annualized basis. This could be due to the fact that they put less of an emphasis on fixed-income securities regularly. Besides mirroring this year, they have possibly diverged in their positions in year's past.
(Source - Fund Fact Sheet)
The fund is currently trading at a similarly wide discount as GLO is of 15.26%. The 1-year average is 11.18%.
Clough Global Dividend and Income Fund (GLV)
Finally, we have GLV. The fund is the smallest of the bunch with $147 million in total managed assets. They last announced the highest leverage ratio of 34.29%.
This fund also has a "high level of total return" as its investment objective. The strategy is the same as GLO's as well. Except they include a stronger emphasis on fixed-income. They note that "the Fund will not invest more than 20% of its total assets in securities rated, at the time of the acquisition, below investment grade." This does mean that while they focus more on fixed-income, it is on the higher side of the quality spectrum.
Their portfolio breakdown is also quite split between equities and fixed-income with a 51.17% to 42.62% split.
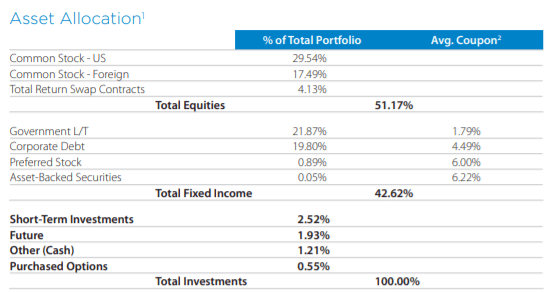
(Source - Fund Fact Sheet)
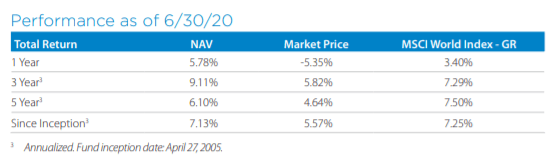
They were the poorest performing of this bunch on a YTD basis, even while having the highest exposure to the "safety" fixed-income area of the investment space.
(Source - Fund Fact Sheet)
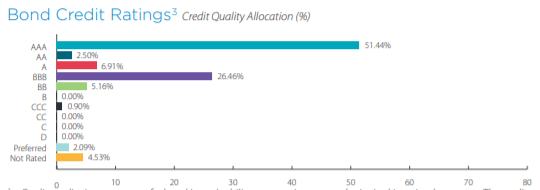
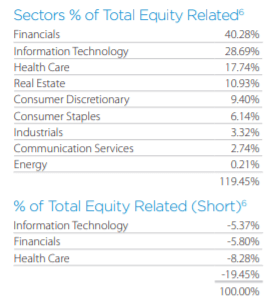
The fixed-income portion of their portfolio was well tilted to the investment-grade area, as their investment policy put a focus on. A factor pulling down this safety play though was the equities they were invested in. They put a large emphasis on the financial sector. This area of the market has been tossed out as the world grapples with a pandemic.
(Source - Fund Fact Sheet)
While they carry short positions that should have helped balance this, it wasn't nearly enough to offset the downside. With that being said, it isn't like the fund is anywhere near the worst performing on a YTD basis.
The fund has a similarly high distribution rate at 12.41%. On a NAV basis that is a distribution rate of 10.96%. The highest of the three funds offered from Clough, but also the worst historically performing due to the larger fixed-income exposure.
(Source - Fund Fact Sheet)
The monthly rate for this year was $0.1008. The rest of their history mirrors its peers above.
(Source - CEFConnect)
One area that is interesting is the fact that the fund is the highest yielding, worst performing; but also, that the fund is the highest valued in terms of discount/premium. The fund currently has a discount of 11.68%, its history shows that it similarly trades at a perpetual discount. The last 1-year average is 10.77%. The higher distribution rate might be luring in investors, as the discount is wide but not as wide as the other two funds.
Conclusion
A word of caution, none of the funds have really earned these higher distribution rates. For 2019 though, they did not have to utilize any destructive ROC as all three funds had NAV growth to offset the distributions paid out. Since they had losses that they could realize on the books still, they were able to pay out some of the distributions classified as ROC though. This can be beneficial for some investors to deter tax obligations until a position is sold.
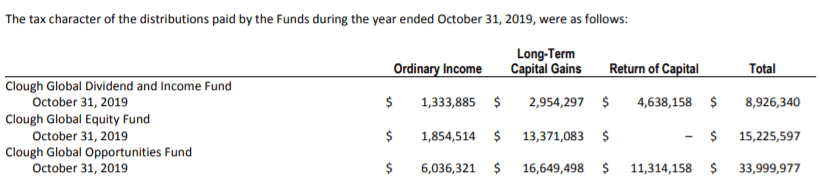
(Source - Semi-Annual Report)
GLQ is the closest to covering their distributions though. Even in 2018, they were able to cover it with income and capital gains. This is thanks to their higher exposure to equities to allow for greater capital appreciation in their portfolio.
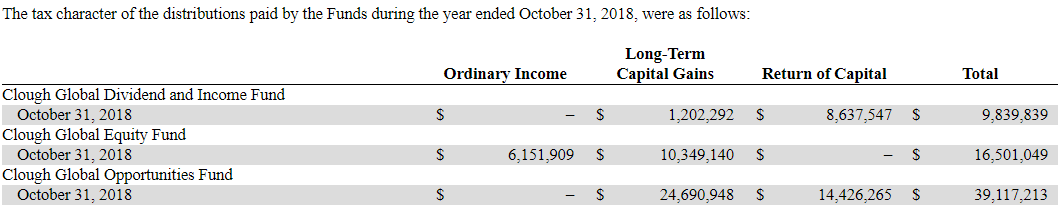
(Source - 2019's Semi-Annual Report)
This higher coverage is also backed up by the fact of their higher annualized returns compared to the others. That's a quick way to check if a fund has historically been able to earn their distribution.
Even with that being said, I believe overall GLO might be the most interesting out of this bunch if one is looking for a highly flexible CEF. The larger size can be beneficial for investors to add more liquidity. Additionally, GLO and GLQ have quite similarly deep discounts, while GLV is trading on a relatively higher valuation. GLQ does have the same flexibility. However, they put more of an emphasis on equity positions. This has led to outperformance over the longer-term. Which might be a better fit for investors that are more aggressive.
I would be avoiding GLV at this time. The slightly higher distribution rate at this time just might not be worth it. Considering that historically they have quite an abysmal total return track record.
Profitable CEF and ETF income and arbitrage ideas
 At the CEF/ETF Income Laboratory, we manage ~8%-yielding closed-end fund (CEF) and exchange-traded fund (ETF) portfolios to make income investing easy for you. Check out what our members have to say about our service.
To see all that our exclusive membership has to offer, sign up for a free trial by clicking on the button below!

Disclosure: I/we have no positions in any stocks mentioned, and no plans to initiate any positions within the next 72 hours. I wrote this article myself, and it expresses my own opinions. I am not receiving compensation for it (other than from Seeking Alpha). I have no business relationship with any company whose stock is mentioned in this article.
Additional disclosure: This article was originally published to members of the CEF/ETF Income Laboratory on August 15th, 2020.