
2020 is a remarkable year for investors across the globe for a few reasons. First, despite the coronavirus and all the damage that the counter-Covid-19 measures have inflicted on the global economy, the U.S. market has fully erased its March losses and touched an all-time high, which left many macro-focused bears confused and disappointed.
At the same time, the year is infamous for the great dividend reset, as a plethora of public companies aggressively scaled down payouts or even suspended dividends to address urgent liquidity issues and avoid a cash crunch. That exacerbated already barely simple situation both for fund managers and retail investors who had to cope with almost-zero or sub-zero bond yields – a direct consequence of the accommodating policy of central banks – which largely complicated the process of building a portfolio of securities calibrated to yield a constant (and perhaps even growing) income stream.
What dividend-oriented investors, who prefer to simplify the portfolio-building routine by investing in ETFs instead of single stocks, might do in this environment? For example, a few might opt for relatively high-yield ETFs like iShares Emerging Markets Dividend ETF (DVYE), which I have discussed recently. The issue here is that EMs are exposed to a plethora of risks, from geopolitics to FX, which can easily shatter dividend payouts and market capitalizations.
Others who have higher risk aversion and would prefer U.S. companies with a more comfortable risk profile might take a close look at the ~2.8% yielding WisdomTree MidCap Dividend ETF (DON), a fund I would like to assess today.
 Source: Unsplash
Introduction. The fund's composition
With total assets of ~$2.52 billion, the WisdomTree MidCap Dividend ETF has a nicely diversified portfolio of 334 stocks.
The fundamentally weighted WisdomTree U.S. MidCap Dividend Index is at the crux of the fund. The WTMDI represents a fraction of a more versatile WisdomTree U.S. Dividend Index and encompasses the top 75% of companies in terms of market value after 300 largest have been removed (section 5.3., page 13).
The index is reconstituted once a year (section 2.4., page 7); the essential variable that is taken into account is a company's projected annual cash dividends. For example, the largest constituent of the fund, The J. M. Smucker Company (SJM), returned ~$397 million to shareholders in FY20 (ended April 2020), while Radian Group (RDN), which has a diminutive weight of 0.03%, paid only $2.1 million in 2019.
The portfolio is dominated by Financials, Real Estate, and Industrials, which account for 22.46%, 15.36%, and 13.61%, respectively. The weight of the top ten stocks is only slightly above 10%, which means the ETF is almost perfectly diversified, which mitigates single-stock volatility.
On a side note, volatility-averse investors might find DON relatively attractive, as its 60-month beta is 1.05, which means the ETF is only marginally more volatile than the overall market. But for a dedicated value investor, DON will likely not be an ETF of choice, as 21.74x P/E of WTMDI is only slightly below iShares Core S&P 500 ETF's (IVV) P/E of 22.86x.
Past performance: lagging behind the market and some closest peers
Unfortunately, both price and total returns of DON are barely comparable with the S&P 500, no matter the time horizon. For instance, this year, the ETF is down ~21.6%, while the overall market is up ~5.27%. As DON is dividend-paying, its total return is a bit less depressed, equals ~19.95%, but the S&P 500 is again ahead even here with a TR of 6.7%. No doubt that the wild card of the coronavirus has been behind such bleak returns this year.
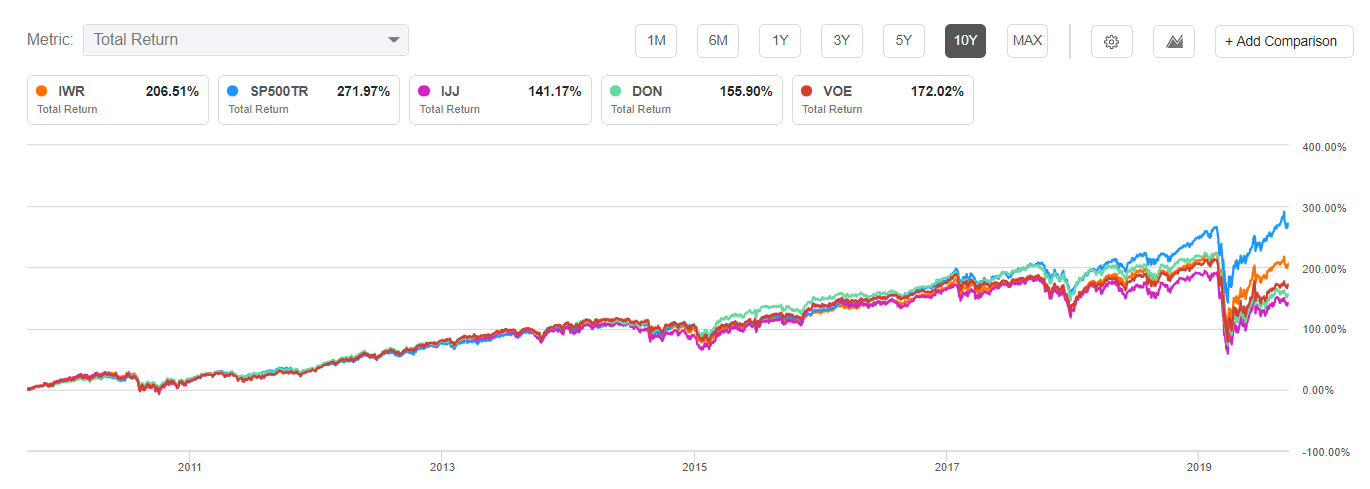
But if we extend the time horizon, the overall market had again easily trounced the ETF. For example, the S&P 500 delivered a 10-year total return close to 272%, while the TR of DON over the same period was just 154.6%.
The primary culprit I see here is its low exposure to the IT (only ~7.38% of holdings) and healthcare sectors (~1.41%), which have been the market darlings this year amid the Covid-19 economy, the remote work trends, and other matters my readers are likely perfectly aware of.
DON also delivered slightly worse 10-year total returns than some of its closest peers like iShares Russell Mid-Cap Value ETF (IWR) and Vanguard Mid-Cap Value ETF (VOE), while iShares S&P Mid-Cap 400 Value ETF (IJJ) was a bit weaker.
 Source: Seeking Alpha
What again might be the key culprit of underperformance? I reckon precisely the same: its low exposure to the healthcare and IT sectors.
A deeper look at the top 10 holdings
Now let us take a more in-depth look at DON's ten largest holdings.
 Created by the author using the All Holdings dataset.
- J. M. Smucker, a packaged food & meats company, has a 17-year-long dividend growth story. SJM has a copious FCFE of ~$1.2 billion with the FCFE/Dividends paid ratio of ~2.9x, which means the rewards are not in jeopardy at least in the medium term.
- A ~3.2% yielding CenterPoint Energy (CNP), a utility company, had axed the payout this year to protect liquidity, secure coverage of hefty capex, and address the anticipated precipitous decline in 2020 revenues, which will be the consequence of portfolio recalibration, or, more specifically, the divestment of Energy Services/Infrastructure Services.
- Despite being a packaging company with lower dependence on the economic cycle, WestRock (WRK) was not immune to the headwinds stemming from the pandemic. The company had to radically cut the DPS in April.
- Franklin Resources (BEN) is an asset management holding company and a member of an upper-echelon club of high-yield dividend aristocrats (see the article). Analysts are expecting the DPS growth to continue.
- Campbell Soup (CPB), a packaged foods industry heavyweight, has decided not to slim down the DPS this year, as it benefited from the coronavirus-related trends, and its revenues touched a decade zenith of $8.69 billion. However, CPB prefers to manage the payout conservatively: the previous time it boosted the DPS was in 2016.
- Revenues of C.H. Robinson Worldwide (CHRW), a third-party logistics company with a ~0.97% weight in DON, have been in decline since 2018. However, CHRW is clearly not cash-strapped, as, according to my calculations, LTM FCFE covered $275.9 million in dividends paid 3x.
- Whirlpool (WHR) is a household appliances company with a 10-year dividend growth story. Despite pressure on the top line, its LTM cash flow rose to the highest level in five years, while organic FCF to Equity covered dividends paid ~2.6x.
- Eastman Chemical (EMN), a DON constituent with a ~0.948% weight, is one of the chemical heavyweights I cover relatively regularly. The company was battered by the pandemic, its revenues cratered. But thanks to opex and capex optimization, its DPS looks relatively secured.
- Newell Brands (NWL) operates in the housewares & specialties industry. Though its revenues have been creeping lower since 2019, cash flow remained relatively resilient; NWL's FCFE/Dividends paid ratio stands at 2.39x.
- For Targa Resources (TRGP), a midstream company focused on natural gas, the oil market calamity of 2020 resulted in a sharp decrease in revenues. Thankfully, net CFFO was robust, but the company still radically cut the DPS by almost 90%.
The yield
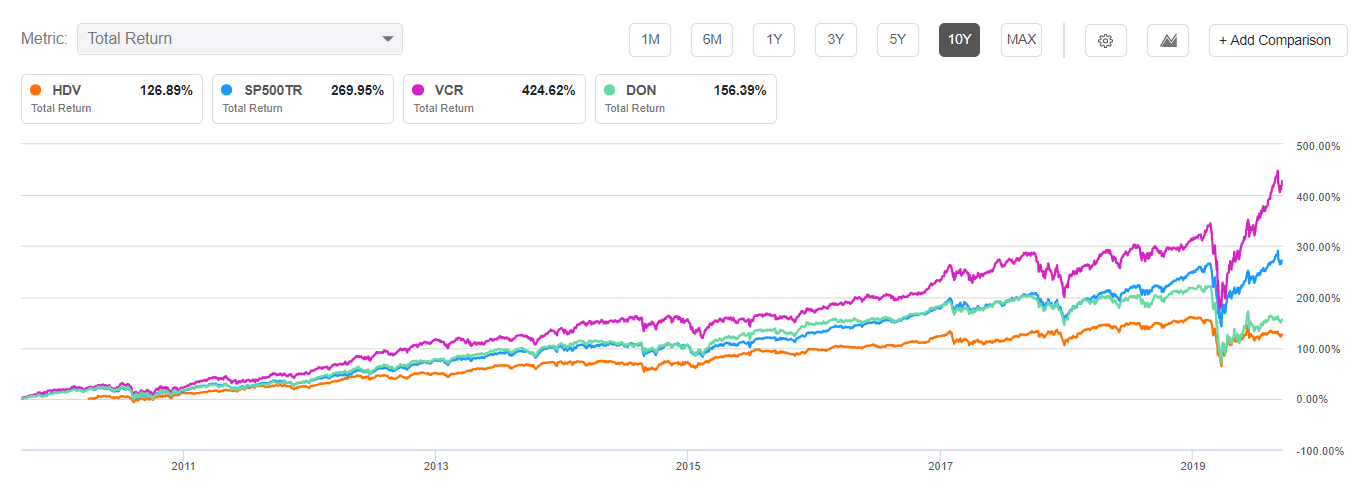
Sure, the 2.82% fund distribution yield is not bumper, and income starved investors might find better options like 4.1% yielding iShares Core High Dividend ETF (HDV) or 6.4% yielding Vanguard Consumer Discretionary ETF (VCR) that I found using Seeking Alpha ETF Screener.
Regarding total returns, in the previous ten years, DON outperformed HDV, which has a material dependence on the embattled energy sector (~18.6% of holdings) but lagged behind VCR, which was bolstered by the outperformance of AMZN (~23.88% of holdings). And if the sector rotation ultimately materializes, DON and HDV might benefit from greater investor attention to cyclical names.
 Source: Seeking Alpha
Importantly, VCR and HDV have much lower expense ratios: 0.1% and 0.08%, respectively, while DON has 0.38%.
However, the essential benefit of DON is monthly cash distributions, which investors can use for any purpose they consider apt.
Final thoughts
The great dividend reset left many investors confused, but it does not mean that income opportunities have entirely evaporated. Mid-cap-focused DON is one of them. However, investors who prefer higher exposure to IT or defensive sectors like consumer staples should opt for other ETFs, which are overweight respective industries.
Disclosure: I/we have no positions in any stocks mentioned, and no plans to initiate any positions within the next 72 hours. I wrote this article myself, and it expresses my own opinions. I am not receiving compensation for it (other than from Seeking Alpha). I have no business relationship with any company whose stock is mentioned in this article.